MatplotlibStyle#
Download this notebook from GitHub (right-click to download).
import matplotlib.pyplot as plt
import numpy as np
from matplotlib import cm
from matplotlib.figure import Figure
import panel as pn

pn.extension(sizing_mode="stretch_width", template="fast")
Styling Matplotlib for Panel#
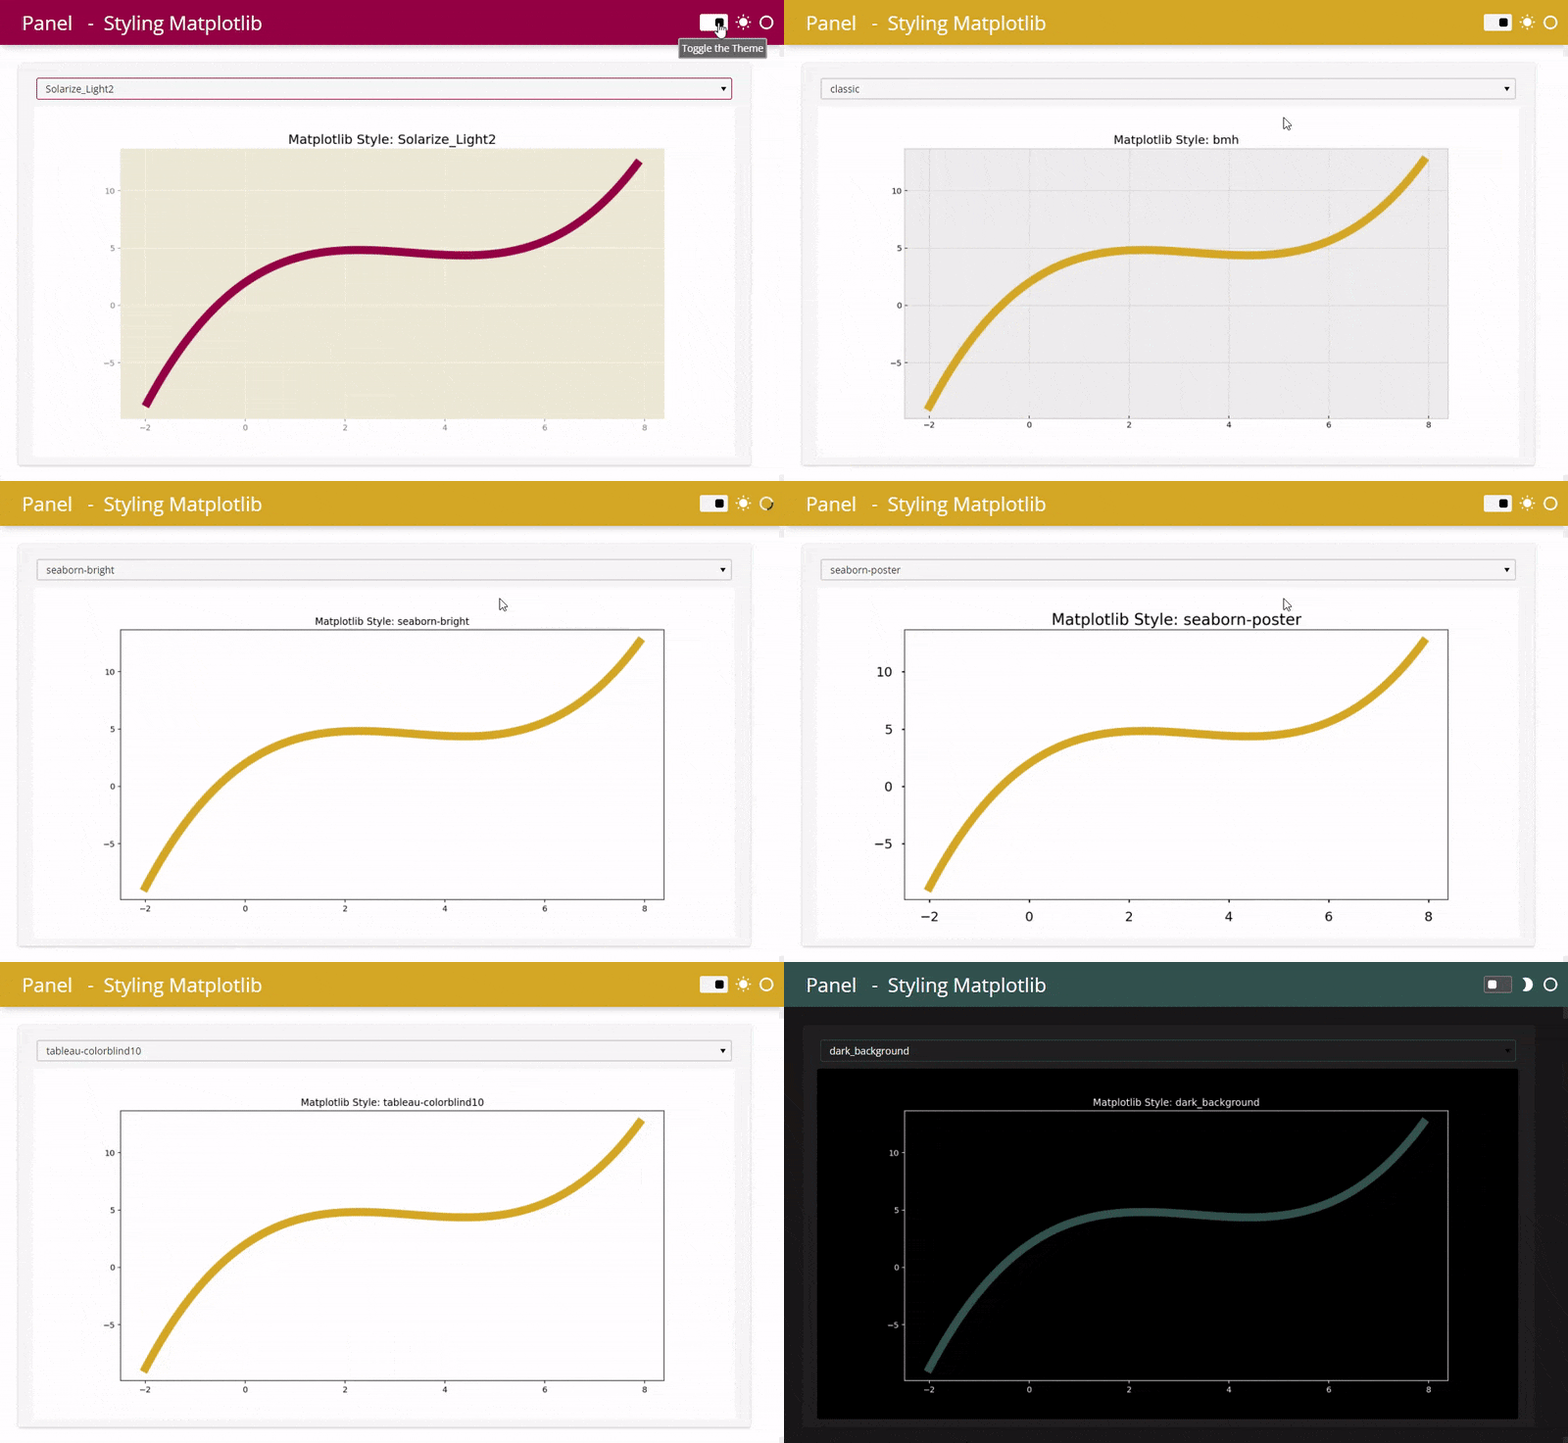
In this example we will show how to style Matplotlib charts with Panel for both the default and the dark theme.

Get or set the theme#
When we use the Fast templates the theme can be found in the session_args.
def get_theme():
    return pn.state.session_args.get("theme", [b'default'])[0].decode()
theme=get_theme()
theme
'default'
Select a nice accent color#
Below we create some functionality to cycle through a list of nice accent colors. You would probably just set the accent_color and color for your specific use case.
nice_accent_colors = [
    ("#00A170", "white"), # Mint
    ("#DAA520", "white"), # Golden Rod
    ("#F08080", "white"), # Light Coral
    ("#4099da", "white"), # Summery Sky
    ("#2F4F4F", "white"), # Dark Slate Grey
    ("#A01346", "white"), # Fast
]
def get_nice_accent_color():
    """Returns the 'next' nice accent color"""
    if not "color_index" in pn.state.cache:
        pn.state.cache["color_index"]=0
    elif pn.state.cache["color_index"]==len(nice_accent_colors)-1:
        pn.state.cache["color_index"]=0
    else:
        pn.state.cache["color_index"]+=1
    return nice_accent_colors[pn.state.cache["color_index"]]
accent_color, color = get_nice_accent_color()
pn.pane.Markdown(f"# Color: {accent_color}", background=accent_color, height=70, margin=0, style={"color": color, "padding": "10px"})
Matplotlib#
There are nearly 30 builtin styles to matplotlib that can be activated with the plt.style.use function. The style names are available in the plt.style.available list.
Let’s define a Select widget to explore the templates.
style=pn.widgets.Select(options=[style for style in sorted(plt.style.available) if not style.startswith("_")])
If the theme is dark we will use the dark_background style as the default value.
if theme=="dark":
    style.value="dark_background"
Lets define a plot
x = np.arange(-2, 8, .1)
y = .1 * x ** 3 - x ** 2 + 3 * x + 2

def get_plot(theme="default", accent_color=accent_color, style=style.value):
    plt.style.use("default") # Resets to default style. Just in case it was styled to something non-default somewhere else in your app
    plt.style.use(style) # changes to the specified style
    fig0 = Figure(figsize=(12, 6))
    ax0 = fig0.subplots()
    ax0.plot(x, y, linewidth=10.0, color=accent_color)
    ax0.set_title(f'Matplotlib Style: {style}');
    plt.style.use("default") # Resets to default style. Do this if you are styling matplotlib in multiple places in your app.
    return fig0
Lets bind get_plot to the style widet and lay out the two in a Column.
get_plot=pn.bind(get_plot, style=style)
matplotlib_component = pn.Column(style,pn.panel(get_plot, height=500, sizing_mode="scale_width"))
matplotlib_component.servable()
For more check out the Matplotlib style sheets reference and the alternative themes dracula theme and gadfly.
Style the app template#
pn.state.template.param.update(accent_base_color=accent_color, header_background=accent_color)
Serve the app#
You can serve the app via panel serve MatplotlibStyle.ipynb and find it at http://localhost:5006/MatplotlibStyle. You should add the --autoreload flag while developing for hot reloading.
Download this notebook from GitHub (right-click to download).